What Is Return on Ad Spend (ROAS)?

ROAS (Return on Ad Spend) is revenue generated divided by ad spend, and you calculate it by using attributed revenue from a defined attribution window over the total spend bucket you decided counts as advertising cost. The formula is ROAS = campaign revenue / ad spend.
Here’s what matters most right now:
- Calculate ROAS as attributed revenue divided by total ad spend for the same window.
- Write your spend definition in plain English, then keep it fixed month to month.
- Include platform media costs, fees, and creator costs if they are tied to the ads.
- Standardize a 48 to 72 hour readout for creative tests to avoid window drift.
- Use channel-specific ROAS views so you do not hide winners inside blended results.
- Treat reported ROAS as an estimate when attribution is imperfect, not a fact.
We built Advertisable AI because performance teams need controlled iteration, not more noise. Once your ROAS rules are locked, our Advertisable AI Studio helps you ship one-variable creative batches with Brand DNA guardrails, storyboard approval, and scene-level edits, then export platform-ready assets for Meta, TikTok, and YouTube.
Start by pinning down what ROAS actually measures in one sentence: revenue earned per ad dollar, with a simple example you can sanity-check in 10 seconds.
ROAS means revenue earned per ad dollar

ROAS is simple math, but it becomes misleading the moment you let the rules drift mid-report. To keep stakeholders aligned, you must lock two definitions and refuse to “fix” them after results come in: what counts as ad spend, and which attribution window earns the revenue.
The ROAS formula
ROAS (Return on Ad Spend) is revenue attributed to ads divided by ad spend. It answers one question: how many dollars of revenue you generated for each $1 you paid to run the ads.
You will see the same number expressed three ways: as a ratio (4:1), as a multiplier (4.0x), or as a percentage (400%). These formats are equivalent as long as the numerator and denominator are defined the same way every time you report.
The most common reporting error is time mismatch. Your revenue and spend must cover the same measurement period, or you are quietly changing the math. For example, pairing one week of spend with one month of attributed revenue will inflate the ratio even if performance did not improve.
- Ratio: “4:1” means $4 in attributed revenue for every $1 in spend
- Multiplier: “4.0x” means the same thing, just written as a factor
- Percentage: “400%” is (revenue ÷ spend) × 100
A plain worked example
If your ads drove $400 in attributed revenue and you spent $100, your ROAS is 400 ÷ 100 = 4. That is 4:1 ROAS, also written as 4.0x or 400%.
In operations terms, this number is only as credible as your inputs. You should be able to point to the exact spend bucket you used and the exact attribution window you used, and show that you did not change either one after seeing the outcome.
What the number does not say: it does not tell you whether those purchases would have happened without ads, whether another channel influenced the conversion, or whether the revenue arrived inside or outside your chosen attribution window. It also does not explain why performance moved, only what the revenue-to-spend ratio was under your current rules.
- $400 attributed revenue ÷ $100 ad spend = 4.0 ROAS
- Written as a ratio: 4:1
- Written as a percentage: 400%
Why ROAS matters when you are making budget calls
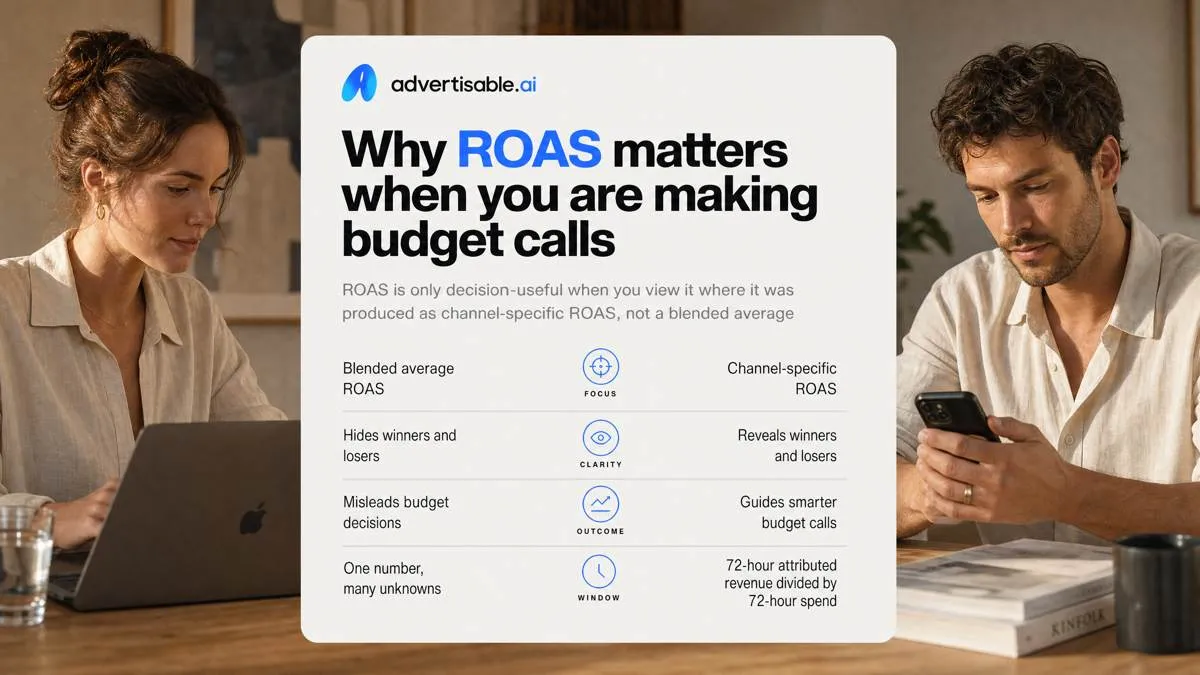
ROAS is only decision-useful when you view it where it was produced: as channel-specific ROAS (Meta, TikTok, YouTube), not a blended average that hides winners and losers.
You also need to report the window in the same breath as the number, for example “72-hour attributed revenue divided by 72-hour spend.” Leaving the window implicit is how stakeholders get misled.
The decision it supports
ROAS is a budget-call metric because it converts performance into a single question: where does your next dollar go. A 48 to 72 hour readout is usually enough to decide whether to scale, hold, or cut without waiting for perfect attribution.
Use it to allocate budget across campaigns by ranking like-for-like views (same channel, same attribution window, same spend definition). When you mix these, you can “improve” ROAS on paper while shifting dollars away from the actual driver.
For creative testing, we treat ROAS as a readout on one-variable batches. You hold constant the creative anatomy (body, proof element, CTA), change one variable (often the hook), and decide the next batch based on the highest revenue per dollar, not vibes.
As an early warning signal, a sudden ROAS drop within the same window and spend rules usually indicates a real issue: the campaign is being served differently, the creative fatigued, or tracking changed. You can intervene before a full reporting cycle is burned.
- Budget allocation: scale the highest channel-and-window ROAS; cap spend on the lowest until you have a new hypothesis
- Creative testing readouts: ship single-variable variants and read after 48 to 72 hours on the same window
- Early warning: investigate when ROAS shifts sharply while spend definition and window stayed fixed
Comparability beats precision
Stakeholders do not need the most “precise” ROAS; they need a ROAS you can compare across months and experiments. The fastest way to mislead a room is to change what counts as spend or change the attribution window after results land.
Lock the same inputs month to month. Decide what is in your ad spend bucket and keep it stable, including platform media costs, agency fees, and creator costs if they are tied to the ad output.
Lock the same window per experiment. If you read one test at 72 hours and another at 14 days, you did not run two tests, you ran two different measurement systems. attribution window research is clear that longer windows usually increase reported ROAS by capturing delayed conversions.
Avoid post-hoc rule changes. Pre-commit to the window, the spend definition, and the kill rules, then treat any exceptions as a new report with a new label, not a “fixed” version of the old one.
- Month-to-month: use the same spend inclusions every reporting cycle
- Per experiment: use one fixed readout window (commonly 48 to 72 hours) for every creative batch
- Governance: document rules before launch and never revise them after you see performance
A good ROAS depends on margin, not a universal target
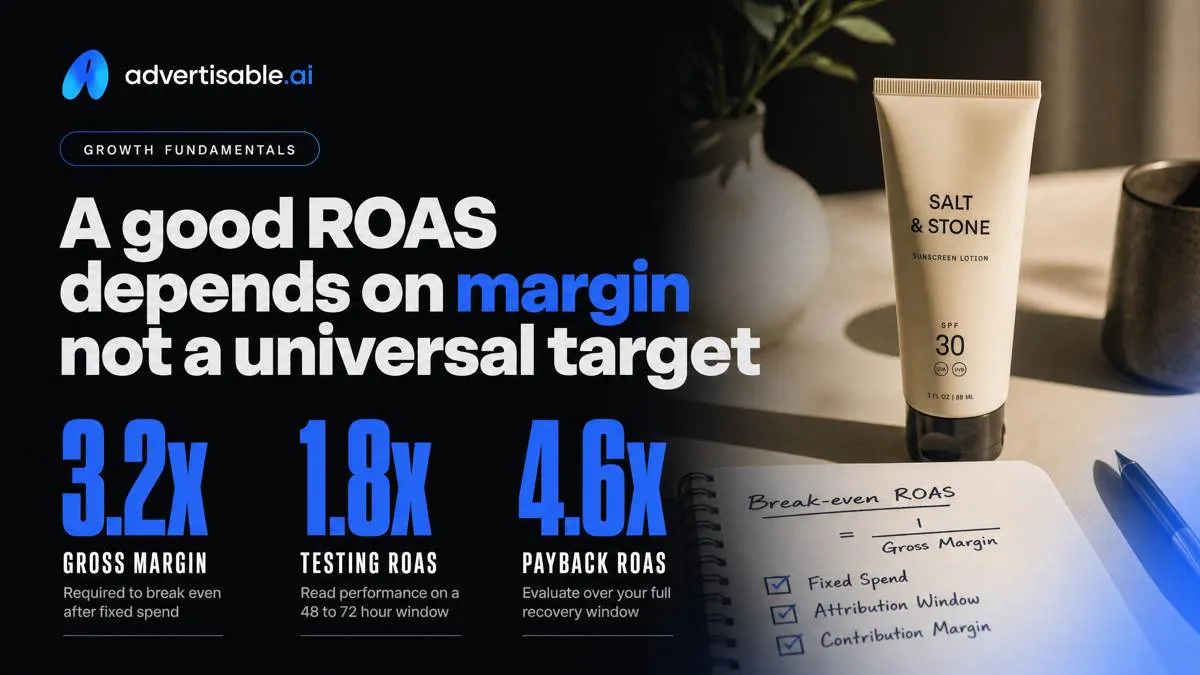
The most common reporting mistake is treating a single ROAS target (like 2x or 4x) as a rule. Benchmarks are only context; the only ROAS that matters is the one that clears your break-even economics under your fixed spend definition and attribution window.
Separate testing ROAS from payback ROAS. For creative tests, read performance on a fixed 48 to 72 hour window so you can compare variants cleanly; for payback, evaluate over the window your business uses to recover spend, which can be longer and should not be mixed into test readouts.
Break-even ROAS explained
Break-even ROAS is simple math: 1 divided by your margin. If your margin is 50% (0.50), break-even is 1 / 0.50 = 2.0x; below that, you are not covering costs on that sale.
Start with gross margin because it is usually the fastest number you can trust at scale: (revenue minus COGS) / revenue. That gets you a first-pass threshold you can use to sanity-check whether a “good” reported number is even plausible.
For tighter control, move from gross margin to contribution margin for the channel or campaign. This is where you subtract costs that are directly driven by the order and the ads, so your break-even threshold reflects what actually changes when you scale spend.
- Gross margin break-even ROAS: 1 / gross margin
- Contribution margin break-even ROAS: 1 / (gross margin minus variable costs you choose to count, like shipping subsidies, pick-pack fees, payment processing, returns, and promo costs)
High margin vs low margin
High-margin and low-margin businesses do not share a “good” target because their break-even thresholds are different. break-even ROAS analysis gives clean examples: 10% margin requires 10.0x to break even, 25% margin requires 4.0x, and 50% margin requires 2.0x.
Shipping and fulfillment are where low-margin models get squeezed. A product that looks fine on gross margin can become unscalable once you add shipping subsidies, 3PL pick-pack, and higher return rates, because those costs rise with order volume even when media efficiency holds.
Discounting changes the target immediately. The moment you run 20% off, your realized margin shrinks, so the break-even ROAS goes up even if the ad account reports the same revenue per dollar.
- Acceptance criterion for calling ROAS “good”: it clears your break-even threshold after the costs you cannot avoid on incremental orders
- QA check before comparing periods: confirm margin assumptions did not change (price, discount depth, shipping policy, fulfillment fees)
How to calculate ROAS without changing the inputs
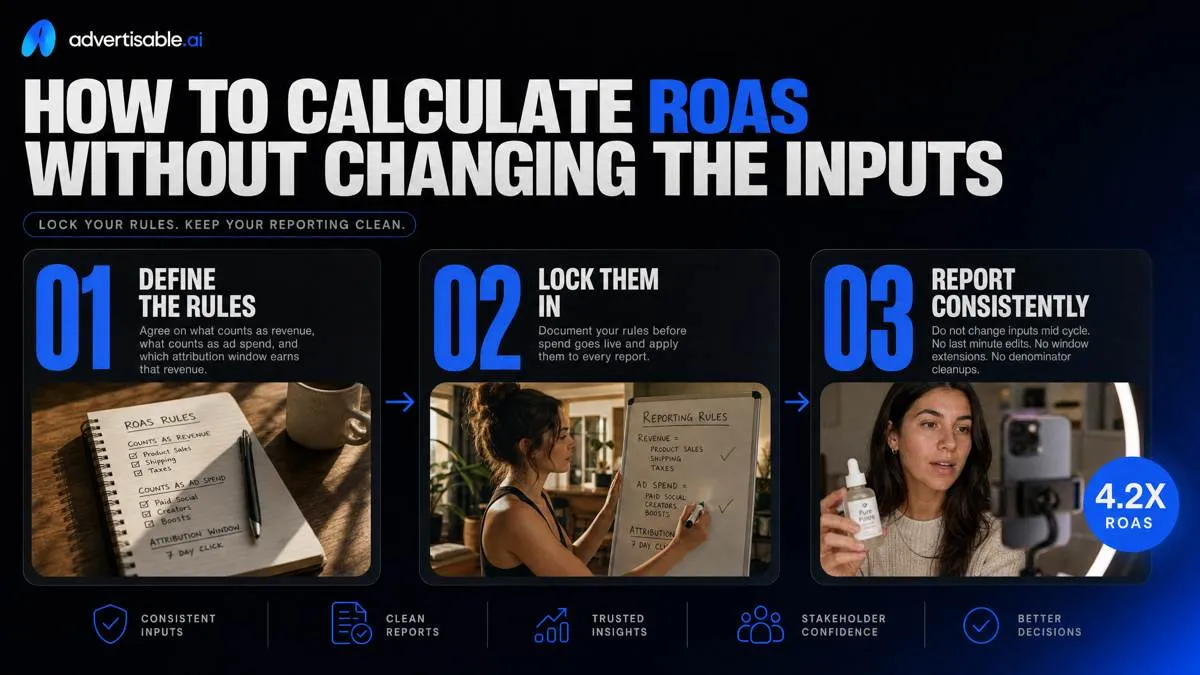
Your formula can be right and your reporting can still be wrong if the inputs shift mid-flight. Before any spend hits the account, write your rules in plain English: what counts as revenue, what counts as ad spend, and what attribution window earns that revenue.
Then lock those rules for the full reporting cycle. Do not “clean up” the denominator after the fact or extend the window to make a readout look better. That is how teams accidentally mislead stakeholders.
What revenue should count
Count only revenue from attributed conversions, inside the campaign window you are reporting. Anything else turns your number into a blended business outcome, not a campaign performance metric.
Operationally, we treat the numerator as “revenue credited by your chosen attribution model” and we match it to the same dates as the spend. If your campaign ran Aug 1 to Aug 7, your revenue should be conversions attributed to that campaign with timestamps that fall inside your agreed window, not all store revenue that happened to occur that week.
The main QA check: pull total store revenue for the same dates next to attributed revenue. The gap is not “missing ROAS.” It is organic demand, other channels, or noise. Keep it out of the numerator unless your stakeholders explicitly asked for a blended view.
- Include: purchase revenue from conversions attributed to the specific campaign or ad set you are reporting on
- Match: revenue and spend to the same reporting period (week, month, or flight), using the same timezone cutoffs across platforms
- Exclude: organic revenue, email-driven purchases, retail or partner sales not credited to the ads, and “lift” you cannot attribute in your reporting layer
What ad spend should include
Your denominator should reflect the full acquisition cost you are willing to be judged on, not just the media line item. The fastest way to inflate performance is to “forget” fees and production that only exist because you are running ads.
At minimum, include platform media costs. Then decide, once, whether platform fees and ad-tied creative costs belong in the same bucket for every report. We prefer you include them because they are real cash out the door and they scale with testing velocity.
Acceptance criteria for clean reporting: your ad spend number should reconcile to finance within a small, explainable delta driven by timing, not by excluded categories.
- Platform media costs: what Meta, TikTok, YouTube, and other channels invoice as spend
- Platform fees where applicable: managed-service fees, ad account fees, or payment processing surcharges tied to ad delivery
- Creator and production tied to ads: UGC creator invoices, editing, motion, voiceover, and tools you use specifically to ship paid assets (allocate across the reporting period with a simple rule and keep it consistent)
Handling attribution lag consistently
Use a fixed 48 to 72 hour readout for creative tests, and do not keep extending it until the result looks good. That window is long enough for delivery to stabilize and for most delayed conversions to start showing up, but short enough that fatigue and budget shifts do not swamp the signal.
Separately, track a longer payback window for how the campaign performs over time. This is where you learn whether a change that looks neutral at 72 hours becomes positive later. attribution window research is clear on the tradeoff: windows that are too short undercount delayed conversions, and windows that are too long inflate results and hide organic growth.
In every report, state the window in the header and in the metric label. Example: “7-day click, read at 72 hours” versus “7-day click, full payback.” Stakeholders stop arguing about the number when they can see the contract you measured against.
- Test readout: 48 to 72 hours from launch (use the same day-part and timezone each time)
- Payback tracking: a longer, predefined window you use for learning and forecasting, not for changing test outcomes
- Reporting hygiene: write the attribution setting and the readout timestamp beside the metric, so comparisons across weeks are valid
ROAS vs CAC vs ROI keeps your reporting honest
ROAS is a revenue ratio, not a profitability verdict. Use it with margin context so you do not “improve” performance while actually buying unprofitable revenue.
Pair it with payback period and LTV so you can see both cash-flow timing and long-run customer value, not just top-line return.
ROAS vs CAC
ROAS tells you revenue per ad dollar; CAC tells you cost per customer. You can raise ROAS by pushing higher AOV orders, while CAC stays flat or worsens if you are paying more per new buyer.
ROAS is primary when you are judging creative and campaigns inside a fixed attribution window. CAC is primary when your question is customer-level efficiency, especially for subscription, trials, or any model where retention changes the economics.
- Use ROAS to decide which channel, campaign, or creative batch gets more budget.
- Use CAC to decide if you can scale acquisition without breaking unit economics.
- For the CAC definition, calculation, and pitfalls, see our CAC sister article.
ROAS vs ROI
ROAS is a revenue ratio; ROI is a profit ratio. Amazon Ads documentation frames ROAS as campaign revenue divided by campaign spend, while ROI expands the “investment” to include broader costs.
ROI pulls in whole-business costs that ROAS ignores: cost of goods, fulfillment, discounts, returns, and operating overhead. That gap is why a high ROAS can still lose money.
Acceptance criteria for honest reporting: keep your ad spend definition fixed (media plus any acquisition-tied fees) and treat ROAS as an input to profitability, not a substitute for it.
What moves ROAS up or down and why creative is the main lever
Once your ROAS rules are locked, improving the number is mostly about removing variability. We built Advertisable AI Studio for that: you import a product URL and generate UGC Ads that stay inside Brand DNA while you test controlled variations.
Drivers you can control weekly
ROAS moves when you change what the user sees, who sees it, or how consistently the platform can deliver. Weekly control comes from tightening the chain from ad promise to purchase and keeping delivery stable enough to compare runs.
- Offer and landing page alignment: the first fold matches the hook, price, and primary proof
- Audience and placement fit: run where the creative reads natively, not where CPM is cheapest
- Budget and delivery stability: avoid frequent edits and big daily swings that reset learning
Creative efficiency and ROAS
Creative is the main lever because it changes conversion per impression without needing more spend. When you hold targeting and budget constant, a better hook-body-CTA sequence drives more attributed revenue from the same delivery.
One-variable batches also shorten the path to a decision, because you can attribute the change to the asset, not to a mixed set of edits.
- Higher conversion per impression: more buyers per 1,000 impressions at the same delivery
- Faster learning with one variable: hook changes are readable in smaller budgets
- Less waste from off-brand ads: Brand DNA guardrails prevent inaccurate claims or mismatched tone
A controlled testing workflow
Run tests in small, repeatable batches. We use a fixed 48 to 72 hour readout so fatigue and delayed attribution do not blur the result.
- Three hook variants per batch; keep body, proof element, and CTA identical
- Preset kill rules before spend lands (for example: stop clear underperformers once delivery is comparable)
- 48 to 72 hour readouts, then ship the winner into the next batch and retest the same variable
Lock your ROAS rules, then test creative with control
Before your next reporting cycle, standardize two inputs and do not touch them mid-readout: one attribution window and one ad spend definition. Use the same rules across Meta, TikTok, and YouTube, then compare like for like.
Next, run a controlled creative batch. We recommend a storyboard-first workflow: generate three hook variants from one product URL in Advertisable AI Studio, keep the body, proof element, and CTA constant, and ship as single-variable tests. Hold spend and duration fixed, then take a 48 to 72 hour readout with preset kill rules.
Acceptance criteria: each variant is on-brand under your Brand DNA guardrails, passes scene-level QA for claims and visuals, exports platform-ready, and produces a clear next-test decision.
Frequently Asked Questions
### What is a good ROAS?
A good ROAS is the one that clears your break-even point for the specific campaign, channel, and time window you are using. Set it based on your margins and payback expectations, then keep the spend definition and attribution window fixed so the target stays comparable over time.
### Is a 2.5 roas good?
It depends on whether 2.5:1 is above your break-even ROAS once you apply a consistent ad spend bucket and attribution window. If your inputs are sliding between reports, 2.5 can look better or worse without any real performance change.
### Is a roas of 1 good?
A 1:1 ROAS means you are attributing $1 of revenue for every $1 of ad spend. Whether that is acceptable depends on margin and payback period, and it is only interpretable if you keep the attribution window and ad spend definition consistent.
### How long should I wait to measure ROAS changes from a creative test?
Use a fixed 48 to 72 hour readout window for creative tests so delivery and conversion lag are handled consistently. Decide your kill rules before spend lands, then rerun the same single-variable test if volume is too low to call.
### What should I include in my ad spend numerator when calculating ROAS?
ROAS uses ad spend in the denominator, and you should define that bucket once and keep it consistent. Most teams include platform media costs, platform fees, and creator or agency costs tied directly to producing and running the ads, and exclude costs unrelated to ad delivery.