What Is Customer Acquisition Cost (CAC)?
 Customer Acquisition Cost (CAC) in marketing is the total paid advertising spend required to acquire one new customer, calculated as total ad spend divided by net new customers in the same time window.
Here’s what you need to get right immediately:
- CAC formula: total ad spend ÷ net new customers acquired in that window.
- Use net new customers only, not orders, leads, trials, or blended organic counts.
- CAC is not CPA, CPM, or cost per trial; those are not customer-level efficiency.
- A “good” CAC is defined by your CAC to LTV ratio and payback period.
- If payback is too slow, scaling spend can still create a cash crunch.
- In paid social, targeting tweaks hit diminishing returns; creative refresh moves CAC faster.
- Lower CAC with one-variable testing: change one hook, hold body and CTA constant.
- Set 48 to 72 hour readouts with pre-set kill rules to avoid post-hoc rationalizing.
We built Advertisable AI for the moment you realize CAC is drifting and the real bottleneck is creative throughput, not another targeting adjustment. Our workflow pulls Brand DNA from a product URL, then lets you generate UGC Ads and iterate with storyboard approval and scene-by-scene regeneration so your tests stay controlled, attributable, and export-ready for Meta, TikTok, and YouTube.
Before you calculate anything, you need a one-line CAC definition your whole team uses, plus a clean way to stop confusing it with other metrics and meanings.
Define CAC in one line, then stop mixing it up
In other contexts, “CAC” can mean a coronary artery calcium test (health) or a unit/role acronym (military); here, we only mean Customer Acquisition Cost in marketing.
The only CAC definition that matters
Customer Acquisition Cost (CAC) is your total acquisition spend divided by the number of new customers you acquired in the same time window.
Two controls make this number usable. First, the numerator must be total acquisition spend, not just platform media: include agency fees, creator costs, and any tools or contractor time you treat as acquisition ops, as long as you apply that rule consistently month to month. Second, you must lock the time window (weekly, monthly, or a campaign flight), because spend and conversion lag will change the result.
The denominator is new customers only. If you include returning buyers, renewals, or reactivations, you are no longer measuring acquisition efficiency; you are averaging in retention performance and making the metric look artificially low.
- Acceptance criteria: numerator and denominator cover the same dates (for example, July 1 to July 31).
- QA check: “new customer” is defined once (first-ever purchase, first-paid subscription, or first conversion event) and enforced in reporting.
- Exclusion rule: repeat orders and existing-customer upsells never count toward the denominator.
CAC vs CPC vs CPM vs CPA
CAC is a customer-level cost. CPC, CPM, and CPA are event-level costs, so they can be useful diagnostics but they are not interchangeable with CAC.
- CPC: cost per click (traffic efficiency). Denominator = clicks.
- CPM: cost per 1,000 impressions (delivery cost). Denominator = impressions/1,000.
- CPA: cost per acquisition event (conversion efficiency).
Denominator = the platform-defined “acquisition” event.
CAC: cost per new customer (business outcome). Denominator = net new customers.
Calculate CAC with the denominator you can defend
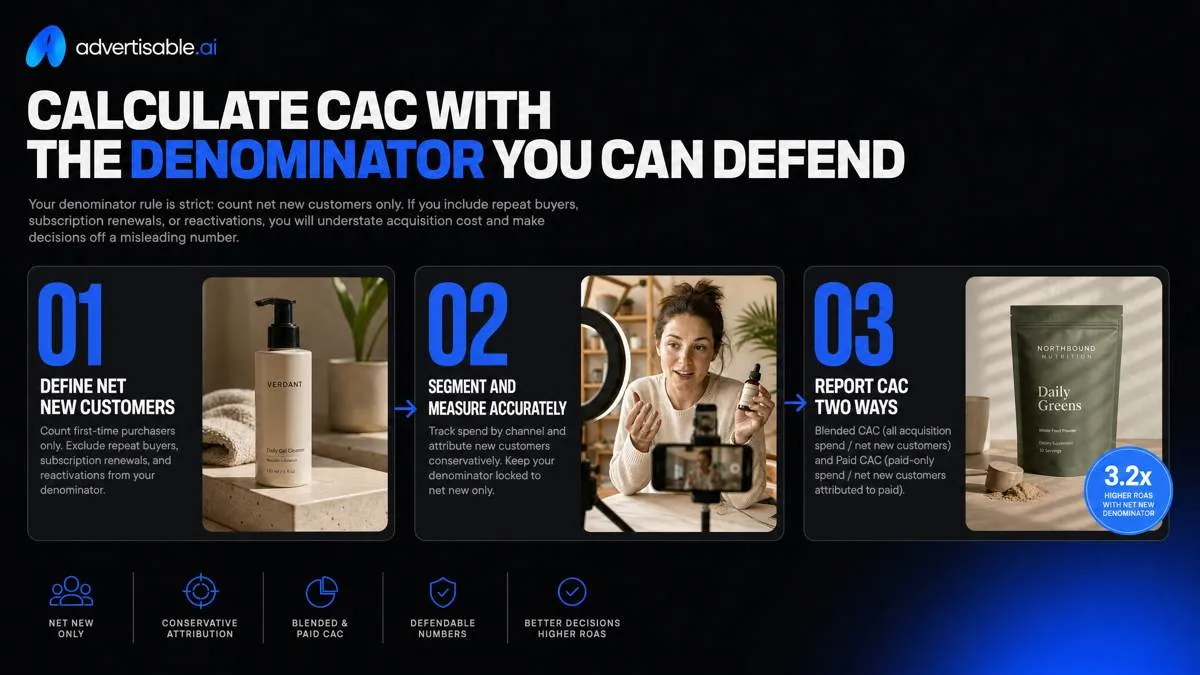
Your denominator rule is strict: count net new customers only. If you include repeat buyers, subscription renewals, or reactivations, you will understate acquisition cost and make decisions off a misleading number.
Keep two labels in your reporting: blended CAC (all acquisition spend divided by net new customers) and paid CAC (paid-only spend divided by net new customers attributed to paid). The denominator stays “net new” in both cases; what changes is the numerator and attribution scope.
CAC formula and worked example
Customer Acquisition Cost (CAC) is total acquisition spend divided by net new customers in the same time window. That is the whole metric, and it breaks the moment you mix periods or count “customers” loosely.
Worked example: In June, you spend $60,000 across your acquisition motion and you acquire 400 net new customers in June. Your CAC for June is $60,000 / 400 = $150 per new customer.
Alignment is the guardrail: spend and customer count must reflect the same period and the same definition of “new.” If your ads drive a lag (click in June, purchase in July), decide a rule once and hold it constant (for example: count the customer in the month they purchase, and match spend to that same month) so your trend line is comparable week to week.
- Acceptance criteria for the denominator: each person is counted once, first-ever purchase (or first-ever paid conversion) only, within the reporting window
- Common denominator inflation mistakes: counting orders instead of customers, counting free trials or leads as customers, including returning purchasers to make CAC look lower
What counts as acquisition spend
The numerator has to match the work required to acquire a new customer, not just what the ad platform invoice shows. If you exclude real costs (or include costs unrelated to acquisition), you will distort the metric in the other direction and lose comparability.
What we include in acquisition spend is anything you would not be paying for at the same level if you paused acquisition tomorrow. That typically spans media, the people and vendors who produce the assets, and the sales motion required to close.
- Paid media plus fees: platform spend plus agency fees, media buying retainers, and measurement fees tied to running acquisition
- Creative production costs: in-house creative payroll allocation, freelancer and studio invoices, UGC creator fees, editing and motion resources used to ship acquisition ads
- Sales comp and tooling: SDR/AE comp tied to new business, commissions, and the tools that enable acquisition (CRM seats, dialers, enrichment) when they are part of your acquisition motion
Once you standardize what goes in the numerator, you can change one thing at a time (for example, creative batches on a 48-72 hour readout) and trust that a CAC movement reflects reality, not accounting drift.
Judge whether CAC is good using LTV and payback
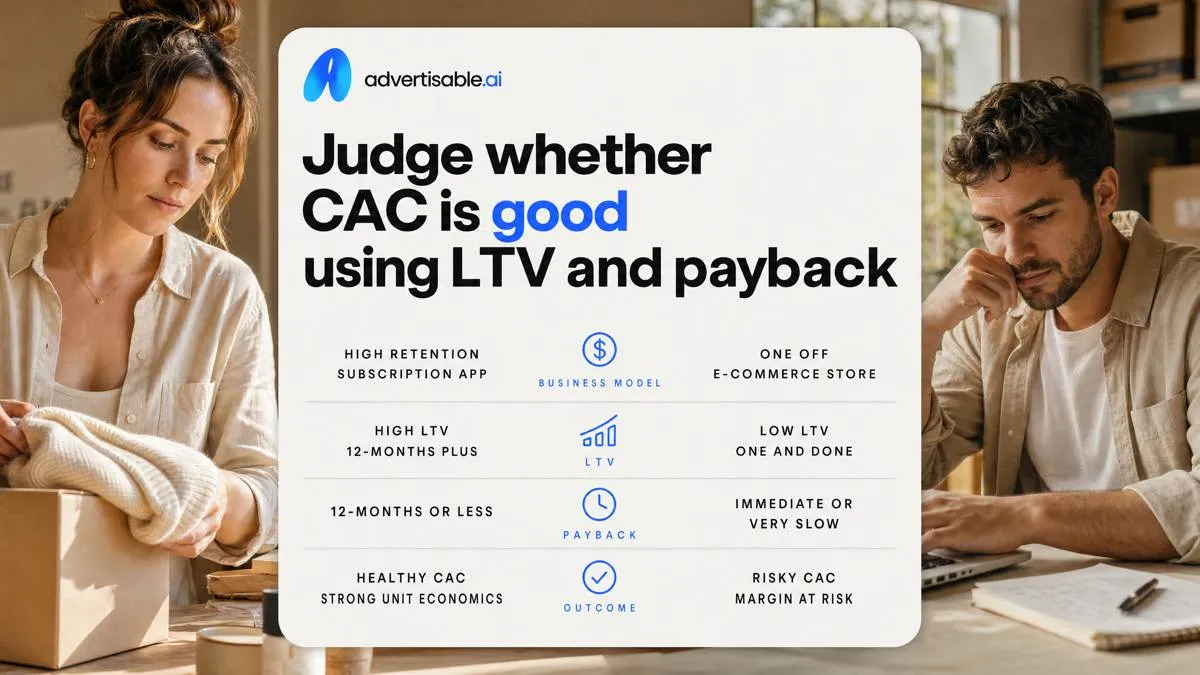
A “good” Customer Acquisition Cost depends on your business model, not a universal benchmark. The same acquisition cost can be healthy for high-retention subscription, and fatal for low-repeat one-off ecommerce.
Gross margin is the first filter because you do not pay back acquisition cost with revenue, you pay it back with contribution margin after COGS, payment fees, support, and the real-world drag of returns, refunds, and chargebacks. If your returns spike, your effective margin drops, and the same acquisition cost suddenly takes longer to earn back.
Subscription dynamics also change the math: you typically recover acquisition cost over multiple billing cycles, while one-off purchases need faster recovery through strong margin, repeat purchase behavior, or upsells that are consistent (not hoped for).
LTV to CAC as a guardrail
The simplest way to judge acquisition cost is whether you earn back more than you spend. That is what the LTV to CAC ratio checks: lifetime value (gross profit, not just revenue) divided by what you paid to acquire the customer.
The commonly cited rule of thumb is 3:1, and Wall Street Prep's SaaS analysis calls out 3.0x as a standard benchmark in SaaS. Interpreted operationally, you are targeting enough unit economics headroom to fund overhead, reinvest in growth, and absorb forecasting error.
It is not a law because “LTV” is not a single, clean number across models and time horizons. A brand with high repeat rates, low support burden, and predictable retention can run closer to the line, while a business with volatile retention, high returns, or heavy onboarding costs needs a wider buffer.
- Acceptance criteria: LTV:CAC stays above your internal floor for at least 2 readouts (48-72 hours each) before you increase budgets.
- QA check: confirm your LTV input is contribution margin based, net of returns and refunds, not top-line revenue.
Treat the ratio as a guardrail for decision-making, not a trophy metric to post in a deck.
Payback period and cashflow reality
Payback answers a different question than LTV:CAC: how long your cash is tied up before you recover acquisition cost. A practical shortcut is payback period = CAC divided by contribution margin per period (for subscription, usually monthly; for one-off, margin per order plus expected repeat contribution).
Slow payback is a scaling risk even when LTV:CAC looks great, because you can run out of cash while waiting for future profit to arrive. Maxio's payback analysis gives an extreme example: $100,000 LTV on $2,000 acquisition cost (50:1) can still be dangerous if payback is two years.
When payback is too slow, change the cashflow math before you obsess over micro-improvements in acquisition cost. Prioritize fixes in this order: improve margin, improve near-term revenue per customer, then reduce acquisition cost through controlled creative iteration.
- Change first: tighten returns/refunds and shipping exceptions that silently erase margin.
- Then: adjust pricing, bundles, onboarding, or annual prepay to pull revenue earlier.
- Then: run one-variable creative batches (48-72 hour readouts) to reduce acquisition cost while holding offer and landing page constant.
Fast payback gives you room to scale spend without financing the gap; slow payback forces you to scale cautiously even if long-term unit economics are strong.
Understand what moves CAC up or down in practice
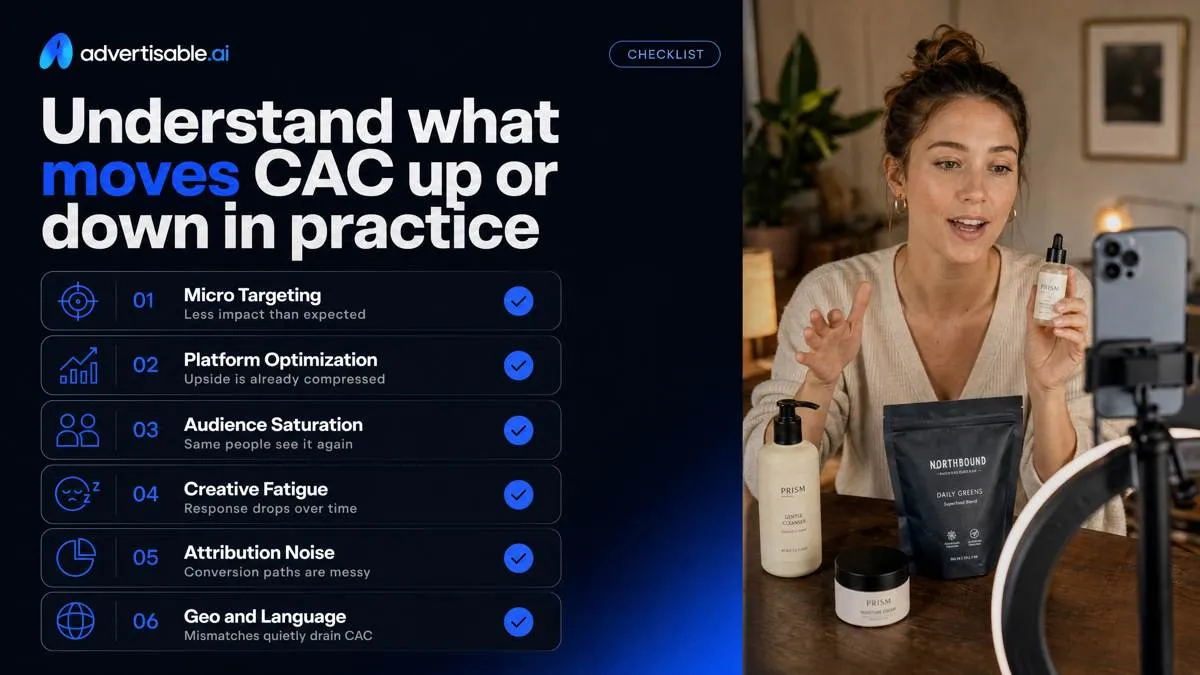
In practice, your acquisition cost moves less from micro-targeting than most teams expect. Platform optimization has compressed the upside, so targeting tweaks often show diminishing returns after you fix obvious exclusions and geo or language mismatches.
What pushes the number up fast is audience saturation and fatigue: you keep spending, but the same people see the same message, so response decays and costs rise. At the same time, measurement adds attribution noise, especially when conversion windows, blended reporting, or delayed purchases make “what caused the customer” hard to isolate in a single dashboard.
Creative efficiency is the biggest lever
The fastest controllable driver of Customer Acquisition Cost is creative efficiency, because better ads usually buy cheaper attention and convert more of it. In our ops reviews, you can often see directionally meaningful changes inside a single 48-72 hour readout when you change one creative variable and hold everything else constant.
Better ads tend to lower CPM and CPA because platforms reward assets that win the auction: higher predicted engagement and conversion leads to better delivery economics. You are not negotiating prices directly; you are improving the input the auction uses to decide what you pay.
Creative also lifts on-site conversion rate by setting the right expectation before the click. When the hook promise, product moment, and proof element match what the landing page actually delivers, you get fewer bounces and more qualified shoppers reaching checkout.
Waste shows up as impressions served to people who never had a chance of converting because the message is unclear, the product is not shown early, or the proof is missing. Tight creative reduces that waste by making the audience self-select faster.
- Run single-variable batches: lock offer, landing page, and CTA; test 5 hooks only
- Set basic QA before spend lands: 1-2 second hook clarity, product shown early, proof readable on mobile, claim accuracy checked
- Use kill rules on a 48-72 hour window so you do not rationalize weak ads after the fact
Offer and funnel friction effects
Your offer and funnel friction can raise or lower acquisition cost even when the ad account is stable. Clear value, clear terms, and a reason to act now reduce hesitation; confusion and extra steps inflate drop-off.
Offer clarity and urgency is not about hype. It is about making the trade explicit: price, what you get, how fast, and what happens next. If you cannot summarize the deal in one sentence, expect higher CPA because the ad has to do more work than it can in a short scroll environment.
Landing page mismatch creates immediate penalties: the ad promises one thing, the page leads with another, or the first screen hides the core product and terms. You pay for the click, then lose the customer before they even evaluate the purchase.
Trust and proof elements are the friction reducers that most teams under-produce. They are also one of the safest places to test because you can keep the offer constant while swapping proof type.
- Mismatch checks: same promise language, same hero product, same price and promo terms as the ad
- Trust checks: shipping and returns visible, payment icons, real reviews or quantified proof where you have it
- Proof testing: keep the script anatomy fixed and rotate only the proof element type (review, before-after, short data point)
If you want to move acquisition cost without guessing, treat the offer and proof as controlled inputs, not as last-minute page copy edits after spend is already committed.
Avoid the CAC mistakes that break your reporting
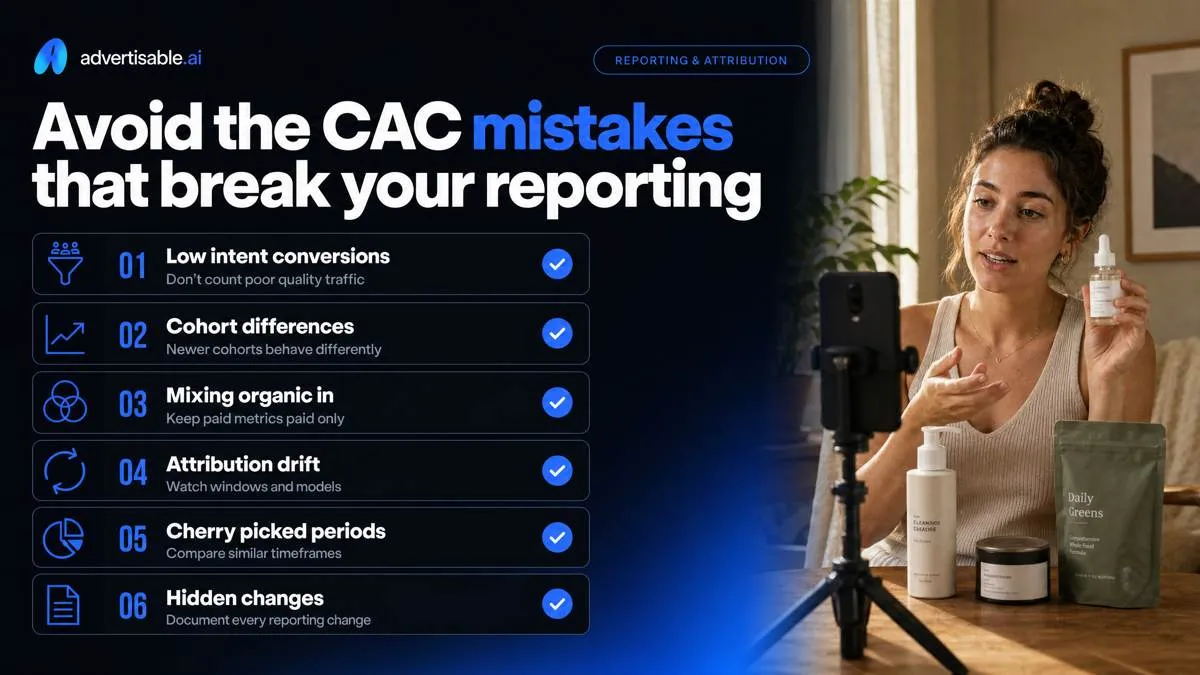
The fastest way to “improve” your customer acquisition cost is to change what you count, not what you ship. We see teams optimize to a lower number by pulling in lower-intent conversions, ignoring that newer cohorts convert and retain differently than last quarter, or quietly blending organic customers into a paid-only metric.
Counting orders, leads, or trials
Your denominator must be net new paying customers in the same time window as your spend, not orders, leads, or trial starts. Each of those will make the metric swing in ways that look like performance changes, even when nothing real improved.
Orders vs customers breaks reporting in ecommerce: one customer can place 2 orders in-week (split shipments, re-orders, gift buys), so “spend / orders” will look cheaper than “spend / new customers.” That hides acquisition issues and turns retention behavior into a fake acquisition win.
Leads are not customers. CAC is a customer metric, so treating lead volume as the denominator turns your number into cost per lead. You can push that down by loosening lead gates, but you usually pay for it later in low intent and low close rate.
Trials are the same trap in SaaS. If you divide spend by trial starts, you are measuring cost per trial. For CAC, the denominator is trial-to-paid: new paid customers attributed to that spend window.
A clean rule is to lock the spend window (for example, 30 days) and attribute paid conversions back to the trial cohort that started in that same window, then keep that method constant month to month.
- QA check: new-customer count should never exceed first-purchase count, and should not move when returning customers spike
- QA check: if you report a trial metric, label it Cost Per Trial and report trial-to-paid rate separately
- Acceptance criteria: denominator definition is written down and unchanged across periods (same window, same “new customer” logic)
When you lock the denominator, you can run 48-72 hour creative readouts without accidentally measuring a different business outcome each week.
Leaving costs out of the numerator
An artificially low acquisition cost usually comes from an incomplete numerator. If you only include platform spend but exclude the labor and fees required to produce, manage, and measure campaigns, your metric will drift as soon as you scale headcount or outsource.
Do a “fully loaded” pass that includes every cost you must pay to acquire customers: media, plus the people and vendors who make the media work. This aligns with Andrew Chen's CAC framework, where leaving out marketing and sales salaries makes the number look better than reality.
Promos and discounts create another misread. If a “new customer” only converts because you gave 20% off, the discount is part of the acquisition cost. Decide once whether you treat discounts as a reduction of revenue or as a marketing cost, then keep it consistent so month-over-month comparisons are real.
Finally, returns and refunds can make performance look better than it is, especially in ecommerce. If you count gross new customers but ignore refunded first orders, your acquisition metric is optimistic while your cash reality is not.
- Include: agency retainers, freelance editors, UGC creators, and contractor media buying fees tied to acquisition work
- Policy decision: treat discounts and promos consistently (either always in the numerator, or always excluded and handled in margin reporting)
- Refund rule: remove fully refunded first purchases from “new customers” or add refunded revenue back as an acquisition cost adjustment
Lower CAC this week with one-variable creative testing
Creative volume only lowers acquisition cost when you can control what changed and why it worked. Otherwise you just create noise faster.
In Advertisable AI Studio, you can import a product URL to extract Brand DNA, then generate variations through UGC Ads and the Video Ad Generator. That workflow keeps claims and visuals consistent while you produce enough controlled variants to learn quickly, then export Meta and TikTok-ready ads without reformatting.
The four beats that change CAC
The fastest way to move acquisition cost in paid social is to test creative anatomy, not random “new ads.” We break each video into four beats and treat each beat like a testable component you can swap in and out.
The rule that keeps results attributable is simple: hold three beats constant and change only one beat per batch. In practice, that means you run 5 to 10 variations where everything is identical except the one beat you are testing, so the readout points to a single cause.
Start with hook testing because the first 1 to 2 seconds usually drives the biggest swing in stop rate and downstream conversion volume. Then move to proof, then the product moment, then CTA.
- Hook: the first 1 to 2 seconds that earns attention and sets the promise
- Product moment: an early, honest scene that shows the product or service in use
- Proof: a credibility element (testimonial, before-after, or a clear data point you can stand behind)
- CTA: the final instruction that matches the offer and funnel step
A 48 to 72 hour test cadence
Run one-variable batches on a 48 to 72 hour clock, with equal budgets per variation, so you are comparing signal instead of spend. That window is usually long enough to see directional conversion outcomes without letting fatigue or day-parting dominate the result, which aligns with Prescient AI's testing methodology.
Decide your kill rules before you launch. Operators lose weeks by “letting it ride” after the data is already telling you the angle is wrong.
- Budgeting: set the same daily budget for each variation and keep placements consistent
- QA before spend: verify the beat you are testing is the only changed scene, and claims match Brand DNA guardrails
- Kill rules (example): stop any variation that is clearly lagging on conversions after the first 48 to 72 hours, or that produces clicks without downstream purchases/trials
- Decision tree: winning hook -> test 5 to 10 new proof variants under the same hook; winning proof but weak conversion -> keep hook and proof, test CTA; no winner -> rerun the same variable with a tighter angle range instead of changing multiple beats
Turn CAC into a lever you can actually pull this week
If your CAC is drifting, stop debating targeting. Control the variable you can ship: creative. We use a repeatable workflow that ties spend to net new customers, then improves CAC through controlled testing and refresh speed.
In Advertisable AI, paste your product URL, lock Brand DNA, and generate 10 hook variations while holding your product moment, proof element, and CTA constant. Export Meta and TikTok-ready ads, launch as a single-variable batch, and run a 48 to 72 hour readout.
Acceptance criteria: each variant differs only in the hook, all claims match Brand DNA, and exports render clean with correct aspect ratios and safe margins. QA before launch, then make one decision: keep the winning hook, swap the next weakest beat, and rerun the same cadence.
Frequently Asked Questions
### What is a CAC in business?
In marketing, CAC is the total paid acquisition spend in a time window divided by net new customers acquired in that same window. It only means something when you can defend the denominator and judge it against LTV and payback.
### How do I know if my CAC problem is caused by poor targeting or poor creative?
If platform delivery and placements are already automated, your fastest diagnostic is a one-variable creative test. If CAC moves when you change only the hook, proof element, or CTA, it is a creative issue; if nothing moves across multiple controlled batches, your offer or funnel friction is the next constraint.
### What CAC should I target for my business?
Set a CAC ceiling from your LTV and payback period, not an industry average. If payback is too slow for your cashflow, you either need lower CAC, higher first-order margin, or a faster path to repeat purchase.
### Why does Advertisable say creative volume only helps if each variation creates a new learning signal?
Volume helps only when you can attribute the result to one change. We recommend keeping the ad anatomy fixed and changing one variable per batch so your 48 to 72 hour readout produces a clear next-test decision instead of mixed signals.