What Is Customer Lifetime Value (LTV)?

Customer lifetime value (LTV) is the total revenue a customer is expected to generate over their entire relationship with your business.
Here’s what matters most right now:
- Use a retention cohort, not blended averages, so your LTV reflects real customer behavior.
- If you run trials, include trial-to-paid rate or your LTV will be overstated.
- Anchor your “months active” to a churn rate assumption you can defend and revisit quarterly.
- Pair LTV with CAC to get an LTV:CAC ratio that flags whether growth is sustainable.
- Add payback period so you know when cash returns, not just how much.
- Do not borrow benchmarks from other businesses; your pricing and retention are the inputs.
We built Advertisable AI for operators who need controllable systems, not vibes, because ad spend only scales safely when your unit economics are explicit. When we set creative testing guardrails, we start with LTV and payback period, then keep production decisions inside those constraints.
Before you touch ratios or payback, you need one clean definition and one usable formula that you can compute from your own inputs in under five minutes. Let’s define customer lifetime value in one sentence and lock the simplest calculation you can QA and update as churn changes.
Define customer lifetime value in one sentence and one usable formula

Customer lifetime value (LTV) is the total value a single customer generates for you over the full relationship.
There is a sophistication spectrum, from a quick back-of-napkin estimate to cohort retention models, but you still want one baseline method you can compute the same way every time.
Revenue LTV you can use today
Revenue LTV is the total revenue you expect from one customer across the entire relationship, not just their first purchase or first month.
The simplest usable formula is: Revenue LTV = Average Order Value (AOV) × Purchase Frequency × Customer Lifespan. The ecommerce LTV benchmarks example math is $80 × 3 purchases × 2.5 years = $600 in revenue-based value.
Operationally, treat this like a controlled metric: define each input the same way every reporting cycle, or your trendline becomes noise. When you change the definition of “frequency” or “lifespan,” you are changing the model, not the business.
- AOV: revenue per order (use a consistent window, like the last 30 or 90 days)
- Purchase frequency: orders per customer per year (or per month, but pick one and hold it constant)
- Customer lifespan: average time between first and last purchase for that cohort or segment
- Cohort or segment specific: compute separately for paid vs. organic, channel cohorts, geo, or product line if behavior differs
Your acceptance criterion is simple: two analysts using the same definitions should land on the same number within rounding.
Profit LTV when margin matters
Profit LTV is revenue-based value adjusted for what you actually keep, so you can make decisions without confusing topline with unit economics.
Start with: Profit LTV = Revenue LTV × Gross Margin. Using the same example, $600 × 65% margin ≈ $390 in profit-based value.
Make gross margin real by including variable fulfilment costs that scale with orders, like pick-pack fees, shipping subsidies, payment processing, and per-unit COGS. Do not bury these in “overhead” if they move with volume.
Avoid mixing revenue and profit across teams: if one dashboard uses revenue LTV and another uses profit LTV, you will argue about conclusions that are just denominator drift.
- Use revenue LTV for forecasting cash-in and topline scenarios
- Use profit LTV for spend limits and payback decisions where margin is the constraint
See the maths with a plain worked LTV example
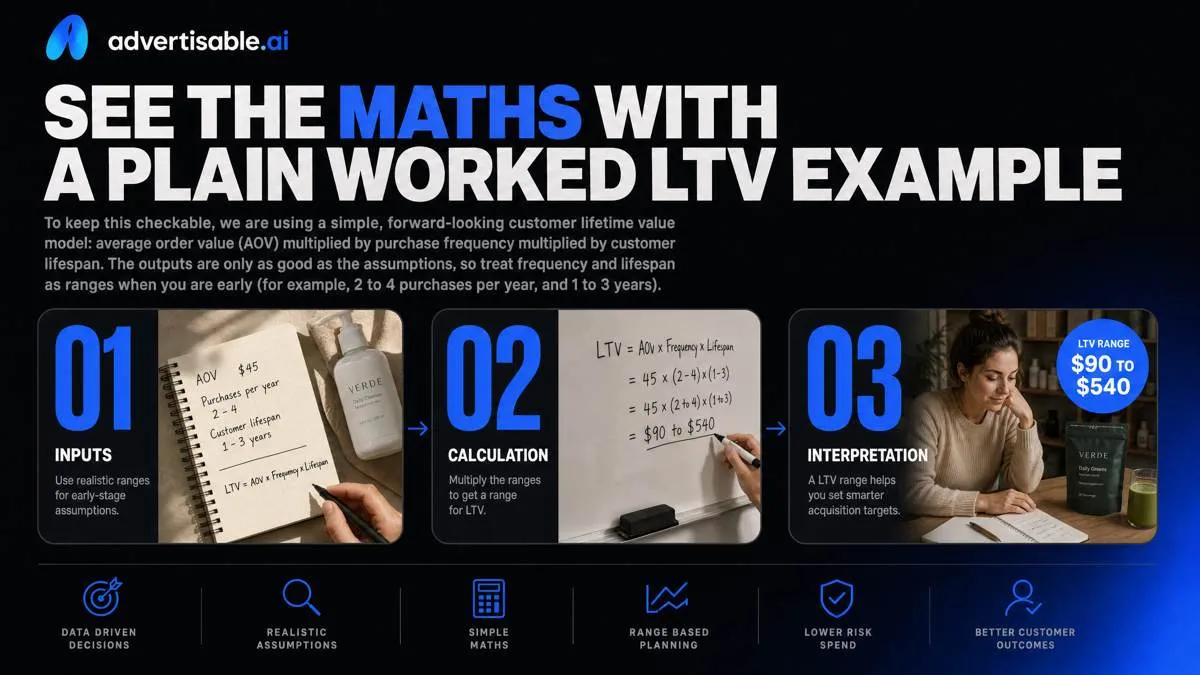
To keep this checkable, we are using a simple, forward-looking customer lifetime value model: average order value (AOV) multiplied by purchase frequency multiplied by customer lifespan. The outputs are only as good as the assumptions, so treat frequency and lifespan as ranges when you are early (for example, 2 to 4 purchases per year, and 1 to 3 years).
Worked example with round numbers
You can estimate lifetime value with one line: AOV x purchases per year x lifespan (years).
Use round numbers so you can sanity-check it fast. Say your AOV is $100. You see a typical customer buy 3 times per year, and you assume an average relationship lasts 2 years.
Revenue-based LTV = $100 x 3 x 2 = $600 in lifetime revenue per customer. If you are unsure on frequency or lifespan, run a range: at 2 to 4 purchases per year and 1.5 to 2.5 years, the same $100 AOV implies $300 to $1,000.
- AOV (simple): $100
- Purchase frequency: 3 per year (range example: 2 to 4)
- Lifespan: 2 years (range example: 1.5 to 2.5)
- Revenue LTV: $600 (range example: $300 to $1,000)
Same example with margin applied
To convert revenue into profit-based lifetime value, multiply by gross margin percent, because ads are paid out of margin, not topline.
Keep the same $600 revenue LTV and apply a 60% gross margin: profit LTV = $600 x 0.60 = $360. You did not change customer behavior, only what is actually available to fund acquisition and overhead.
This is why your acquisition cost ceiling changes. If you used revenue, you might think you can spend close to $600 to acquire a customer. On margin, the absolute ceiling is $360 before you have paid for support, tooling, chargebacks, or returns.
In practice, you set your spend limit below $360 so your payback period and LTV:CAC ratio stay inside your guardrails.
- Revenue LTV: $600
- Gross margin: 60%
- Profit LTV: $360
- Implication: your CAC ceiling drops from $600 (topline) to $360 (margin) before other operating costs
Why LTV is the metric that makes CAC and ROAS meaningful
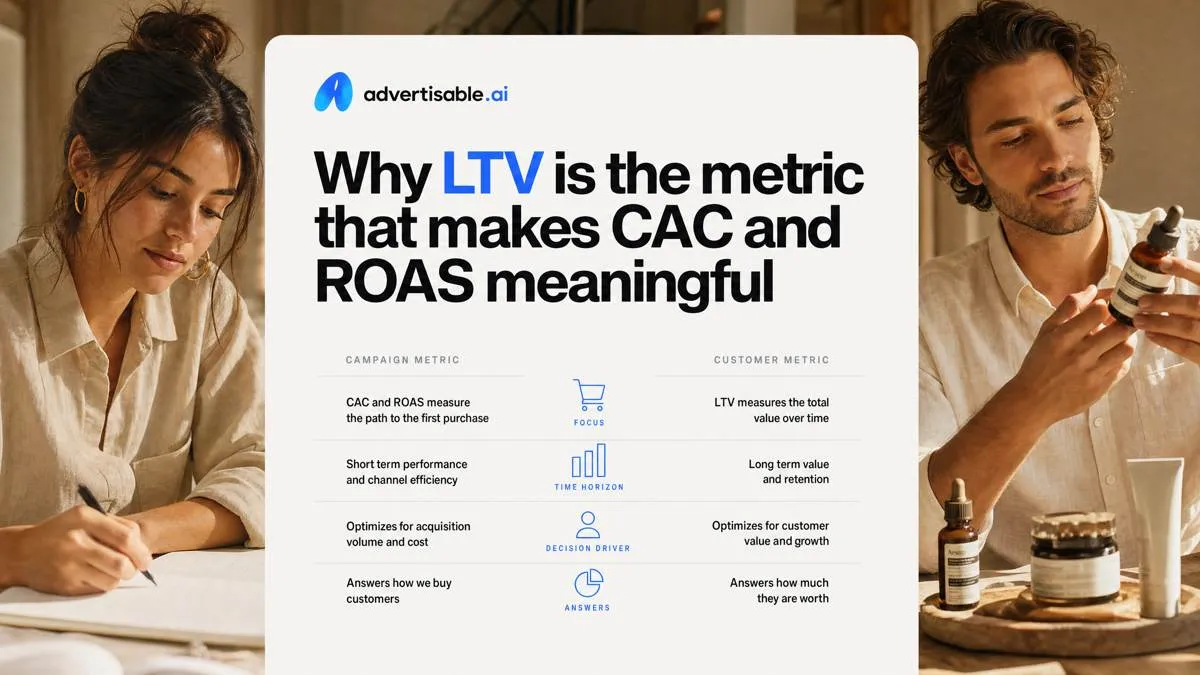
Customer lifetime value is a customer metric, not a campaign metric. CAC and ROAS are the translation layer between ad performance and unit economics, but they only become decision-grade once you view them through lifetime value. For baseline definitions and how to compute acquisition cost cleanly, see our CAC explainer.
LTV sets your spend ceiling
Your maximum affordable CAC comes from lifetime value, not from what the ad account says you can “get away with” this week. In practice, you are setting a ceiling: how much you can pay to acquire a customer and still hit your margin and payback requirements.
We treat this as a guardrail system, with two constraints: (1) profit (will you make enough gross margin over the relationship?) and (2) cash (can you wait long enough to get paid back?). A 3:1 LTV:CAC ratio is a common health check in industry benchmark data, but payback period is usually the operational limiter when you are scaling.
Acceptance criteria we use before increasing budgets: you can hold targeting and landing page constant, run single-variable creative batches, and validate CAC against your modeled lifetime value within a 48-72 hour readout without relying on “eventual” revenue to justify spend.
- Max CAC math: set a target LTV:CAC ratio, then Max CAC = LTV divided by that target (example: $300 LTV and a 3:1 target implies $100 max CAC).
- Profit constraint: use gross margin LTV where possible, not revenue LTV, so fulfillment, COGS, and support do not get ignored.
- Cash constraint: if payback takes 6-9+ months, scaling spend can create a cash crunch even when the ratio looks fine.
- Loss-avoidance check: if you need “phase 2” retention or upsell improvements to make the numbers work, you are scaling into losses today.
ROAS needs the right horizon
ROAS is only meaningful when the time horizon matches how customers actually repay you. A 1-day or 7-day view can understate or overstate performance depending on refund timing, subscription trials, delayed conversions, or promos that pull revenue forward.
Short-window revenue distortion shows up fast in creative testing. One ad can look “better” because it spikes first-purchase revenue, while another looks “worse” because it attracts higher-retention customers whose repeat purchases are not yet counted.
Operationally, we keep the test clean: hold spend, audience, and offer constant; change one creative variable per batch; and read early ROAS as a leading indicator, not a profitability verdict. The decision rule is whether early signals are consistent with your modeled customer value and payback, not whether the first 72 hours look pretty in isolation.
For definitions, common pitfalls, and how to interpret the metric correctly, see our ROAS explainer.
- QA check: confirm your ROAS window aligns with your purchase cycle (same-day impulse vs 30-day consideration vs trial-to-paid).
- QA check: separate new-customer revenue from returning-customer revenue so you do not “double count” retention in campaign reporting.
- Next-test decision: if early ROAS is weak but customer quality indicators are strong, extend the readout and validate against cohort retention before cutting.
Use the LTV:CAC ratio to sanity-check sustainability

You can only call spend “working” when Customer lifetime value holds up against what you pay to acquire customers. That is where CAC and ROAS connect: ROAS is a short-window signal, but LTV:CAC tells you whether that efficiency is structurally sustainable.
Do not cherry-pick a strong promo week or a single platform spike and treat it as your baseline. Keep the time window consistent and read LTV by acquisition cohort so you are not mixing different quality customers into one ratio.
What LTV:CAC is measuring
LTV:CAC measures how much lifetime value you create for every $1 you spend to acquire a customer. If your LTV is $300 and your CAC is $100, your ratio is 3:1.
The “value created” side should be the customer’s total expected contribution over the relationship, not just first purchase revenue. In practice, we prefer LTV built from recurring revenue and retention behavior, adjusted for gross margin, because revenue-only LTV can make acquisition look healthier than it is.
The “cost to acquire” side is your all-in acquisition cost per new customer. Keep the definition stable (same channels included, same cost buckets) so trend lines mean something.
Used correctly, the ratio is a single efficiency summary that prevents you from scaling a channel where unit economics are upside down.
- Acceptance criteria: LTV and CAC are computed on the same cohort and time cut, not blended across months
- QA check: LTV uses gross margin, not revenue, when you are using it to set acquisition ceilings
- Next-test decision: if the ratio deteriorates, hold targeting constant and change one variable in your acquisition engine (usually creative) before you change budget
The 3 to 1 guideline
3:1 is a useful rule of thumb for LTV:CAC, not a law of physics. It is commonly cited because industry benchmark data shows 3:1 or higher is healthy, below 1:1 means you lose money on every customer, and above 5:1 may signal under-investment in growth.
Where you should land depends on margin and cash. Higher gross margin and faster cash collection can support a lower ratio for a period; thin margins or slow collection usually require more cushion.
Do not use the ratio alone. Pair it with payback period so you know whether you recover CAC in 1 month or 12 months, because cash timing determines how aggressively you can scale.
- Guardrail: treat 3:1 as a starting target, then adjust based on your gross margin reality
- Cash check: if payback exceeds your cash runway tolerance, you have to reduce CAC or increase LTV before scaling
- Operating rule: when the ratio looks “fine” but payback is long, your revenue is backloaded and your budget should reflect that
What raises LTV in practice for physical products
Paid acquisition mostly earns you the first purchase. The customer lifetime value you bank is determined by what happens after checkout: whether the customer comes back, how often, and at what margin.
Retention and customer lifespan
Retention is the highest-leverage driver of customer lifetime value for physical products because it extends customer lifespan and compounds every future order. Bain & Company research notes that a 5 percent retention rate increase boosts profit 25 to 95 percent according to Bain & Company.
Operationally, we treat churn and drop-off as a post-purchase system problem, not a creative problem. Fix the experience that causes the second order to never happen: shipping accuracy, damage rates, confusing usage instructions, slow support, and returns friction.
Subscription and replenishment only raise LTV when the product naturally fits a repeat cadence. If consumption is irregular, forcing autoship increases cancellations and support load instead of extending lifespan.
- Churn reduction QA: measure 7-day delivery success rate, damage/defect rate, and time-to-first-response; set an owner and a weekly review
- Post-purchase experience checks: unboxing clarity, “how to use” insert or email sequence, and a no-drama exchange path
- Replenishment fit criteria: clear run-out window, predictable usage, and a customer-controlled cadence (skip, swap, delay) to prevent forced cancellations
Frequency, AOV, and margin levers
Once retention is stable, you raise LTV by increasing purchase frequency, average order value (AOV), and gross margin, without creating buyer remorse. A clean rule holds: every 10 percent AOV lift is a 10 percent CLV lift.
Frequency comes from repeat triggers that are tied to real product usage, not generic promos. You want reminders and reasons that land near the moment the product is needed again.
Bundles and upsells work when they reduce decision effort or complete a workflow. They backfire when they feel like checkout tax or inflate returns.
Margin discipline is the quiet multiplier: tighten pricing floors, audit discounts, and keep COGS from drifting up with packaging, freight, and “one more insert” decisions.
- Repeat triggers: run-out reminders, care/refill education, accessory compatibility prompts, and seasonal restock windows
- Bundles/upsells acceptance criteria: improves value per shipment, does not increase return rate, and keeps contribution margin above your target floor
- Pricing and COGS controls: minimum advertised price guardrails, discount governance (who can approve what), and monthly COGS variance checks by SKU
Common LTV mistakes that break your budget decisions

Do not copy a benchmark LTV from a blog post or a peer brand and treat it as your spend limit. Segment-level behavior (plan tier, channel, geo, first product) can swing customer economics enough that a single blended number will push you into the wrong CAC and payback targets.
Revenue and profit mixed up
The fastest way to blow your budget is using revenue-based LTV to set acquisition spend when your actual constraint is profit and cash recovery. You can only reinvest gross margin, not top-line receipts.
In SaaS calculation analysis, the most common mistake is revenue-based LTV, which can overestimate by ignoring 38% cost of goods in an example with 62% gross margin. That gap becomes pure overspend when you translate LTV into CAC ceilings.
- QA check: your LTV model has an explicit gross margin input, not just ARPA and retention.
- Include shipping, returns, and refunds as negative revenue or cost lines where they exist, or your “value” is structurally inflated.
- Use profit-based LTV (or contribution margin LTV) when defining max CAC and payback guardrails, because those are spend-limit decisions.
Churn and thin data ignored
Second common failure: treating early cohorts like mature ones, then forecasting churn with false precision. A 60-day cohort cannot support a 24-month claim without heavy assumptions.
Thin data shows up as clean-looking spreadsheets with noisy inputs. One dangerous version is time-period mismatch: monthly churn of 2.3% vs correct annual churn of 24.5% in SaaS calculation analysis.
- Cohort age gate: do not “lock” a long-term LTV until you have enough months to see stabilization in retention curves for that segment.
- Forecasting rule: round assumptions to ranges (best, base, worst) instead of single-point LTV with two decimal places.
- Operating rule: treat LTV as a moving estimate and update it on a set cadence (for many teams, quarterly) as churn and trial-to-paid rates evolve.
A light bridge from LTV guardrails to better acquisition creative
Customer lifetime value sets your unit-econ ceiling. Your job on acquisition is to keep Customer Acquisition Cost inside that ceiling so your LTV:CAC ratio and payback period stay workable. Creative does not directly create retention, but it can protect the economics by reducing what you have to pay to acquire the next cohort without changing what the product delivers post-purchase.
Operationally, we treat this as a speed-and-control problem. You want more shots on goal without losing brand accuracy. A URL-first workflow matters because it cuts briefing time: importing the product page gives you the core facts, claims, and assets fast, so you can move straight into storyboard-first production instead of rebuilding context every test cycle.
In Advertisable AI, you start from the product link and a prompt, then generate ads as editable storyboards.
From there, UGC-style ads can be produced directly from product pages, but you still need guardrails. Brand DNA is the non-negotiable layer: what must be true, what cannot be said, and what visuals must look like. Then you enforce it with frame-by-frame control so you can swap only the failing scene (hook, proof, offer, CTA) rather than redoing the full video.
Run single-variable batches and hold everything else constant for a 48 to 72 hour readout. Acceptance criteria stays simple: does the new creative lower acquisition cost enough to fit your LTV guardrails while staying on-brand? If you want to validate the workflow quickly, try the $5 3-day trial and ship a small test set before you scale volume.
Lock your LTV before you lock your plan
Before you apply, run your LTV two ways: once using the purchase price and once using a conservative appraisal estimate. We treat this like a controlled readout. Hold the loan amount constant.
Change only the value input. If the appraisal scenario pushes you over key thresholds, decide your next move now, not mid-transaction.
Use this acceptance criteria before you proceed: you can state your LTV, identify whether it crosses the PMI cutoff, and confirm how pricing changes at the same LTV based on credit score and DTI. Then use the lender questions checklist to get those answers in writing.
If you meant customer Lifetime Value (LTV) instead, we built Advertisable AI to help performance teams scale creative testing while keeping spend inside LTV:CAC and payback period guardrails.
Frequently Asked Questions
### What is the difference between LTV and CAC?
Lifetime Value (LTV) is the total revenue you expect from a customer over the relationship. CAC is what you spend to acquire that customer. You use them together as an LTV:CAC ratio to set a sustainable spend ceiling and sanity-check payback period.
### Why should I calculate LTV before setting my advertising budget?
Because LTV defines the maximum CAC you can afford without breaking unit economics. The second check is payback period, which tells you how long your cash is tied up before acquisition pays back. If payback is too slow, scaling spend can strain cash even when top-line results look fine.
### How do I calculate LTV for a SaaS product with free trials?
Use a cohort-based estimate: trial-to-paid rate × average monthly recurring revenue per paid customer × expected paid months based on churn rate. Recalculate regularly as retention data firms up. Keep the inputs consistent across cohorts so you can compare changes without mixing variables.