What Is Conversion Rate?

Conversion rate (CVR) is the percentage of people who complete your chosen action, calculated as conversions divided by total chances, then multiplied by 100. If 50 people buy after 1,000 qualified visits, your CVR is 5%.
Here’s what matters most if you want a CVR number you can defend in a meeting:
- Define one conversion event that matches your business model, like purchase vs trial-start.
- Match your denominator to the moment, like visitors to a product page, not impressions.
- Lock the same traffic source and attribution window so week-over-week changes stay meaningful.
- Translate percentages into counts so decisions are concrete, like 2% means 2 per 100.
- Read CVR alongside hook rate and hold rate to isolate creative vs offer vs page issues.
- Improve CVR with one-variable tests, holding the rest of the ad and funnel constant.
We built Advertisable AI because performance teams were stuck in a production bottleneck: you could see CVR move, but you could not ship clean, controlled creative iterations fast enough to learn why. Our workflow is storyboard-first with Brand DNA locking and scene-level regeneration, so you can run single-variable batches and trust the 48-72 hour readouts.
Before you optimize anything, you need the simplest, strictest definition of the metric: conversions divided by total chances, with the numerator and denominator chosen on purpose. Once you set that, CVR becomes a diagnostic tool instead of a debate.
Conversion rate means conversions divided by total chances

The plain definition you can repeat
Conversion rate is the percentage of people who take your desired action out of everyone who had the chance to take it. In a meeting, you can say it in one line: “It’s conversions divided by opportunities, expressed as a percent.”
Two details keep you from sounding fuzzy. First, the denominator is the full group that was eligible at that moment (ad viewers, landing page visitors, checkout starters), not a hand-picked subset. Second, “conversion” is not universal: you define the action based on what your business actually values, then you measure that same action consistently.
- Percentage: you report it as a percent so it’s comparable across different volumes (100 visits vs 10,000 visits).
- Everyone who had the chance: you include all qualifying chances in the same timeframe, not just the people you “feel” were interested.
- Action defined by you: you choose the event (for example, purchase vs sign-up) and you stick to it when you talk results.
This is the difference between a metric you can defend and a number that turns into opinion.
The formula and a worked example
The math is simple and that’s why it’s safe to use in performance conversations: conversion rate = conversions ÷ total chances × 100. You can compute it on a whiteboard in 10 seconds.
Worked example: 50 conversions from 1,000 total chances equals 0.05, which is 5%. Say it that way. “We got 50 purchases from 1,000 visitors, so 5%.”
Treat it as a counting exercise, not a narrative. If you cannot state the numerator and denominator as concrete counts for a defined window (for testing we typically read in 48-72 hours), you do not have a conversion rate you can compare week to week.
- Numerator check: “How many completed the defined action?”
- Denominator check: “How many had the chance in the same window?”
- Sanity check: can you repeat those two numbers exactly from the report without qualifying language?
What counts as a conversion
A conversion is whatever action you decide to treat as success, and that definition changes by funnel and business model. Common examples include a purchase, a sign-up, a lead submission, or a click.
Operators separate macro conversions (the main outcome you’re paid to drive) from micro conversions (steps that predict the macro outcome). You can track both, but you cannot talk about “the conversion rate” without saying which one you mean.
- Macro conversion examples: purchase completed; qualified lead submitted; account created (if that is the primary goal).
- Micro conversion examples: click to product page; add to cart; start checkout; trial start; key on-page click.
- Naming standard: write the exact event name you’re reporting (for example, “Purchase” or “Lead Form Submit”), not a vague label like “Converted.”
When you name the event explicitly, you remove the most common source of confusion: two people arguing while using different definitions.
Lock your CVR so the number stays meaningful
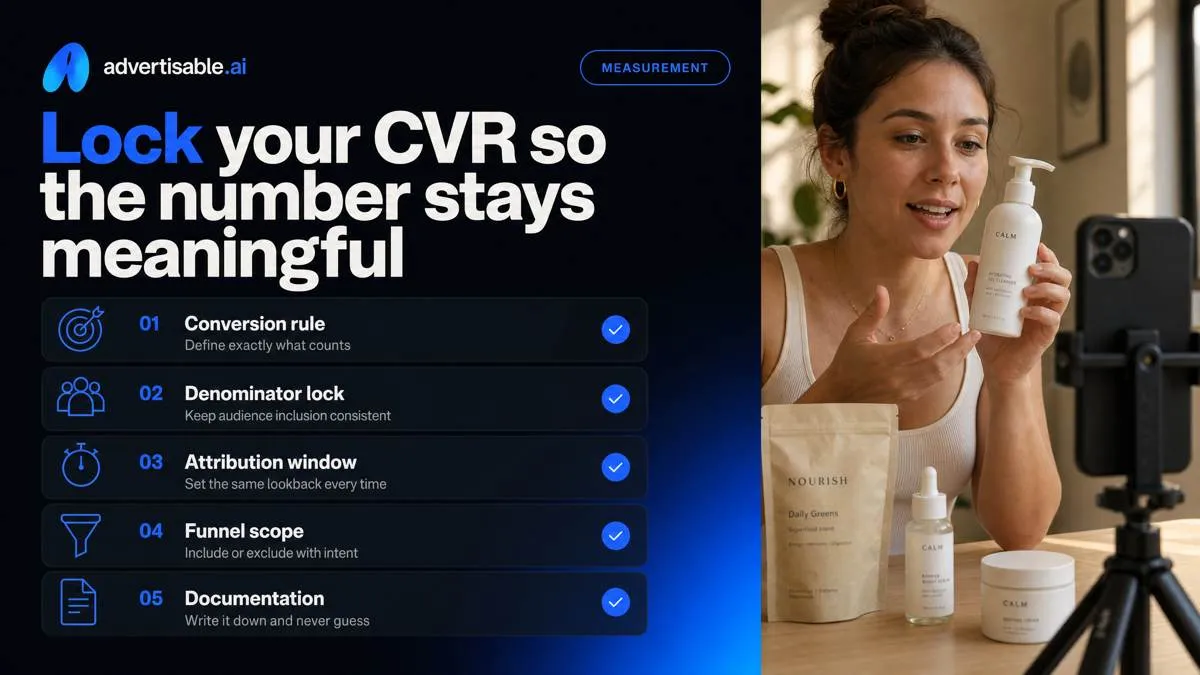
Most bad optimization calls come from treating conversion rate as a stable KPI while quietly changing what counts as a conversion, who is in the denominator, or how long you wait for credit. Lock those rules first, or you will be comparing different metrics with the same label.
Pick one conversion that matches the model
Choose one conversion event and keep it fixed for the decisions you are trying to make. A purchase-based model should report purchases; a free-trial model may need trial-start as the primary event, but you cannot treat those as interchangeable and still trust the number.
A common failure mode is mixed funnel reporting: your creative test deck uses trial-start CVR because it moves faster, while your weekly performance report uses purchase CVR. That creates false winners. The ad that drives low-intent trials can look "better" in the test window and still lose money downstream.
The operational rule: pick the event that actually drives your next decision. If you are deciding which hook variant to scale, choose the deepest event you can measure reliably within your readout window. If purchases take too long to attribute cleanly, use trial-start only if it is proven to predict purchases for your funnel, and document that mapping once.
- Acceptance criteria: the same conversion definition appears in your platform reporting, your BI/dashboard, and your experiment tracker.
- QA check: spot-audit 10 conversions to confirm they are the intended event (not upsells, renewals, or duplicate events).
Choose a denominator that fits
Your denominator must match the moment you are evaluating. “Conversions per website visitor” answers a landing page question; “conversions per ad viewer” answers an ad plus landing path question.
Visitors versus ad viewers is not semantics. If one report uses sessions and another uses unique visitors, your rate will shift without any real performance change. Clicks as a denominator is especially risky in video-led campaigns because click behavior is heavily influenced by placement and intent; it can inflate or deflate the rate while purchases stay flat.
Lock one denominator per use case, and keep the step consistent across reports so your comparisons are real.
- Landing page CVR: purchases (or trial-starts) divided by qualified page visitors in the same timeframe.
- Ad path CVR: purchases divided by ad viewers you are willing to treat as “a chance to convert” (define viewer threshold once).
- Avoid denominator drift: do not compare a “click-to-purchase” rate this week to a “visit-to-purchase” rate next week.
Keep source and window consistent
Channel changes the meaning of the rate, so you need channel-specific reporting rules. A Meta paid social CVR is not comparable to a TikTok CVR unless you standardize what traffic qualifies, what event counts, and where the conversion is being measured.
Attribution window consistency is the other non-negotiable. For controlled testing, we typically hold a 48-72 hour readout so you are not mixing “one week of spend” with “one month of credited revenue.” Pick one window and keep it constant across every test cycle.
Translate percentages into counts before you act. A 2% rate sounds concrete, but it can be two purchases out of 100 visitors or 200 purchases out of 10,000 visitors, and those require different confidence levels and next-test decisions.
- Reporting rule example: Meta uses the same attribution setting every week; TikTok uses its own fixed setting; you do not blend them into one “overall” rate for creative decisions.
- QA check: every report includes (1) source/channel label, (2) attribution window, (3) numerator event name, (4) denominator definition.
- Sanity check counts: always show conversions and denominator next to the percent so “2%” is never interpreted in isolation.
Conversion rate is the efficiency layer under CAC and ROAS

Once you’ve defined your conversion action cleanly, it becomes the efficiency layer underneath your spend metrics. CVR is the input that quietly changes what you see in What Is Customer Acquisition Cost (CAC)? and What Is Return on Ad Spend (ROAS)?, and it’s the bridge to durability in What Is Customer Lifetime Value (LTV)?.
Why CVR moves acquisition economics
Higher CVR directly improves acquisition economics because you get more purchases from the same traffic and spend. That lowers CAC and lifts ROAS without needing a new audience, a higher budget, or a new channel.
In unit terms, CAC is basically spend divided by conversions. If conversions go up while spend stays flat, CAC falls. ROAS is revenue divided by spend, so if the same spend produces more orders, revenue rises and ROAS improves.
This is why teams obsess over measurement discipline: the same campaign can look “better” or “worse” based on how you define the conversion and which window you report. With the rules held constant, a CVR lift is one of the cleanest ways to get more outcomes from the same inputs.
In CAC optimization research, a 30% improvement in conversion rate effectively reduces CAC by 23% without changing any upstream marketing activities.
- Same spend, more orders: your budget buys more completed actions
- Lower CAC: cost per acquisition drops because the denominator (conversions) grew
- Higher ROAS: more conversions typically means more revenue captured per dollar
How CVR links to LTV decisions
CVR is not automatically “good” if it comes from the wrong customers. The real decision is quality vs quantity: do your changes increase completed actions while keeping customer value stable, or are you pulling in marginal buyers who churn fast or refund?
LTV is what makes a CVR gain sustainable. When you evaluate a lift, you want it to hold under the LTV:CAC math, not just improve a 48-72 hour dashboard snapshot.
Use What Is Customer Lifetime Value (LTV)? as the reference when you’re deciding whether a higher rate is worth scaling, especially if you’re trading off conversion volume against customer fit.
- Healthy lift: CVR up and downstream customer value stays consistent
- Risky lift: CVR up but repeat purchase, retention, or refund behavior deteriorates
- Scaling rule: treat LTV as the constraint that decides how aggressive you can be on acquisition
The compounding effect of small lifts
Small CVR lifts compound because funnels multiply, not add. With stable traffic and stable reporting rules, tiny percentage changes turn into meaningful volume at the bottom of the funnel.
Example math with fixed inputs: 100,000 visits at 2.0% yields 2,000 purchases. Move to 2.2% and you get 2,200 purchases, an extra 200 outcomes with zero incremental traffic.
The constraint is control. Keep traffic source, attribution window, and conversion definition locked so you can trust that a lift is real and comparable week to week.
Avoid vanity micro-wins that only move a proxy metric. A higher hook rate or click-through rate is only a win if completed actions rise under the same rules.
- Hold constant: channel, audience stage, attribution window, and the conversion event
- Accept the lift only if it persists across a full 48-72 hour readout
- Reject “wins” that improve intermediate rates but do not increase conversions
A good conversion rate is relative to action, source, and intent

In performance reviews, the safest way to sound technical is to refuse generic benchmarks and instead pin “good” to three variables you can defend: the conversion action, the traffic source, and the audience’s intent at the moment of the click.
Action difficulty changes the baseline
A “good” rate starts with what you asked the user to do. A purchase will almost always convert lower than a sign-up because it demands trust, payment, and commitment, not just curiosity.
This is also where teams get embarrassed in meetings: they celebrate clicks (or a high CTR) as if they were conversions. A click is a hand-raise. The conversion is the completed action on the page or in the app.
Keep macro and micro actions separate in reporting. You can use micro actions to diagnose, but you should not benchmark them against macro outcomes.
- Macro conversions (business outcomes): purchase, paid plan start
- Micro conversions (diagnostics): add-to-cart, email capture, “start checkout”
- Acceptance criterion for a benchmark conversation: everyone agrees on one event name, one numerator, one denominator, and one timeframe (48-72 hours is a clean testing readout)
When you anchor on the action’s difficulty, you stop arguing about the number and start evaluating whether the flow is earning enough trust to justify that action.
Traffic source sets expectations
The same offer can perform “well” or “poorly” purely based on where the visitor came from. Cold audiences (first touch from a feed) behave differently than warm audiences (retargeting, email, branded search).
Platform reporting also changes the story. Meta, TikTok, and YouTube can use different attribution defaults and view-through logic, so two dashboards can show different outcomes for the same behavior.
For meeting-ready comparisons, keep it like-for-like: same source, same attribution window, same conversion event. If you mix them, you are benchmarking noise.
- Cold vs warm: segment results instead of averaging them together
- Platform differences: document the attribution window and whether view-through is included
- Use external context sparingly: 2026 landing page benchmarks notes that cold social is typically the lowest-intent paid traffic, so “low” rates there are not directly comparable to higher-intent sources
Intent and promise must match
Intent is the why behind the click, and your promise has to match it. If the ad implies one outcome and the landing page asks for a different commitment, your rate will look “bad” even with strong creative.
We treat this as message match: the first 3-5 seconds of the ad, the headline on the page, and the primary proof element should all resolve to the same claim in the same language.
You do not need universal benchmarks to be credible. You need a controlled baseline: hold source and tracking rules constant, then test one promise or proof element at a time and read results after 48-72 hours.
- Offer clarity QA: price, what’s included, and what happens after purchase are unambiguous above the fold
- Proof QA: reviews, demo, before-after, or quantified results appear before the main call to action
- Benchmark statement you can defend in a meeting: “Good equals improving against our own baseline for this exact action, from this exact source, under the same attribution rules.”
Diagnose CVR by pairing it with hook and hold rate
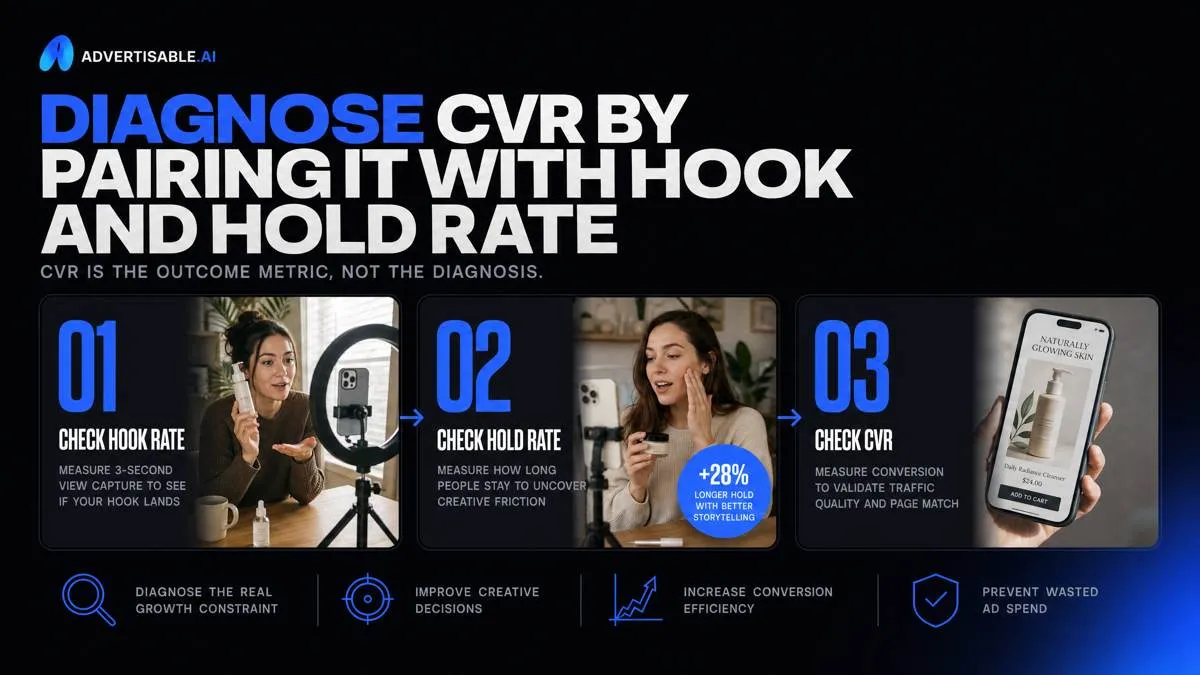
CVR is the outcome metric, not the diagnosis. Pairing it with hook rate (3-second view capture) and hold rate (how long people stay) prevents the most common mistake we see: changing the ad when the real constraint is traffic quality, page match, or broken measurement.
What else drives CVR besides ads
A swing in CVR can be caused by changes outside the ad, even when hook and hold look stable. Treat it like an input-output system: if attention is steady but outcomes move, your constraint is usually audience quality, offer and landing page alignment, or tracking.
Audience quality shows up as “same watch behavior, worse purchase behavior.” A small targeting expansion, new placement mix, or pushing spend into colder pockets can drop purchase intent without changing view metrics.
Offer and landing page alignment breaks when the ad promise and the page reality diverge: price is higher than implied, the hero section answers the wrong question, or proof is missing for the claim that earned the click.
Tracking and attribution errors are the silent killer. Pixel events, domain verification, UTMs, and attribution windows must be consistent, or you will interpret noise as performance.
- Audience QA: compare CVR by audience stage (cold vs warm) and by placement for the same 48-72 hour window
- Alignment QA: check that the first screen of the page repeats the ad’s promise in the same words and shows the primary proof element
- Measurement QA: confirm the conversion event, attribution window, and event deduplication did not change between periods
Creative relevance is a real lever
Creative can lift CVR when it makes a clearer promise that the right buyer can self-select into. The goal is not higher curiosity, it is tighter relevance, which usually increases both click quality and downstream purchase rate.
Proof and claims accuracy matter because they determine whether your landing page can “cash” the check your hook wrote. If the ad implies a specific outcome, the page needs matching evidence fast: demo, before-after context, specs, or credible testimonials.
Creative is not the only lever. When hook rate is high but CVR is flat, we do not keep polishing the opener; we tighten the offer-page handshake and validate tracking before we call it a creative problem.
- One-variable batch rule: change only the promise in the first scene, hold the body and CTA constant, read results in 48-72 hours
- Acceptance criteria: the new hook improves CVR without a drop in hold rate that suggests bait-and-switch
- Production control: lock claims and product facts to avoid “better performing” variants that are not true to the offer
A 20% CVR drop decision tree
When CVR drops 20% week over week, you do not guess. You run a quick sequence: validate tracking, then use hook versus hold patterns to decide whether this is fatigue, mismatch, or an off-ad issue.
Start with measurement because it is binary: either you are counting the same conversion the same way, or you are not. Then read the attention stack: hook tells you if the opener still earns the view; hold tells you if the body still sustains belief.
If you need to ship controlled hook variants fast, we built Advertisable AI Studio for storyboard-first, Brand DNA-guardrailed, scene-level edits so you can swap only the opening and export platform-ready files without rewriting the whole ad.
- Step 1 (tracking): confirm pixel event fired, attribution window unchanged, and no recent catalog/page URL changes broke parameters
- Step 2 (pattern read): hook down + hold down typically points to an opener problem; hook stable + hold down points to body/proof mismatch; hook up + CVR down points to overpromising or landing page disconnect
- Step 3 (fatigue vs mismatch): fatigue looks like declining hook across the same audience; mismatch looks like stable hook with worsening hold and lower CVR after the click
Turn CVR from a debate into a repeatable test cycle
If your CVR is drifting, your next move is not another benchmark search. Your next move is a controlled batch where you know exactly what changed. We recommend one objective metric per test: purchase CVR for ecommerce, or trial-start CVR for trial funnels.
Hold your traffic source and attribution window constant, then isolate a single creative variable.
Open Advertisable AI Studio and build Brand DNA from your product URL. Start storyboard-first: duplicate your current best ad, then generate a small batch of one-variable hook variants while keeping the body, offer, and landing page unchanged. Run the batch on Meta or TikTok with 48 to 72 hour readouts.
QA before export: correct claims, clean captions, consistent branding, platform-ready formatting. Keep winners, kill losers, and decide the next test based on whether hook rate, hold rate, or CVR moved.
Frequently Asked Questions
### What does a 2% conversion rate mean?
It means 2 out of every 100 people in your defined denominator completed your defined action. The number is only interpretable after you lock the action, the denominator, the traffic source, and the attribution window.
### How do I calculate my conversion rate?
CVR equals conversions divided by total chances, then multiplied by 100. Just make sure your conversions and your denominator come from the same source and the same reporting window.
### What is a good conversion rate for video ads?
There is no universal target because the baseline changes by action difficulty, audience intent, and platform. Set your own baseline with consistent definitions, then judge improvements by downstream economics like CAC and ROAS.
### Why can hook rate be high but conversion rate low?
A strong hook can win attention while the promise, proof, or landing page fails to close. When that happens, hold the hook constant and test the body and proof layer, plus ad-to-page message match.
### How often should I test conversion rate and how long should I wait for results?
Use 48 to 72 hour readouts for creative tests so you can act on clean signals without overfitting to one-day noise. Change one variable per batch so you can attribute any CVR movement to a specific edit.